
Coordinate Grid Printable
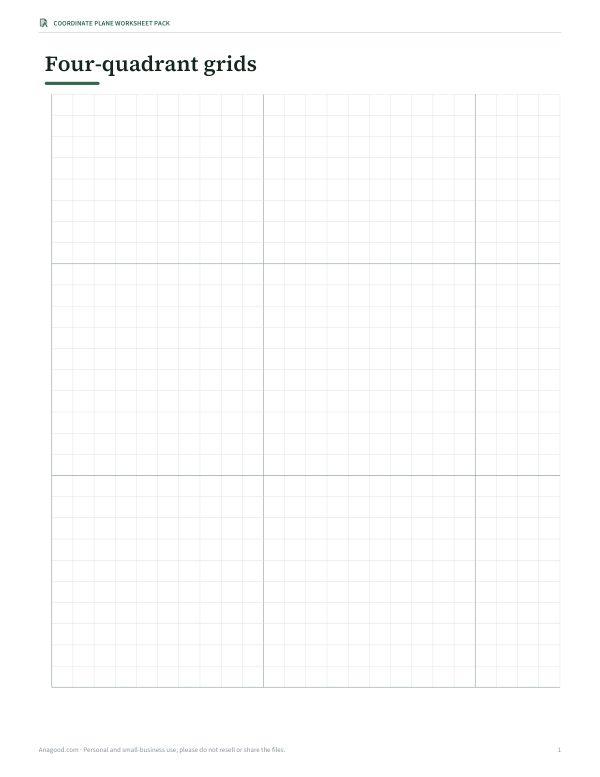
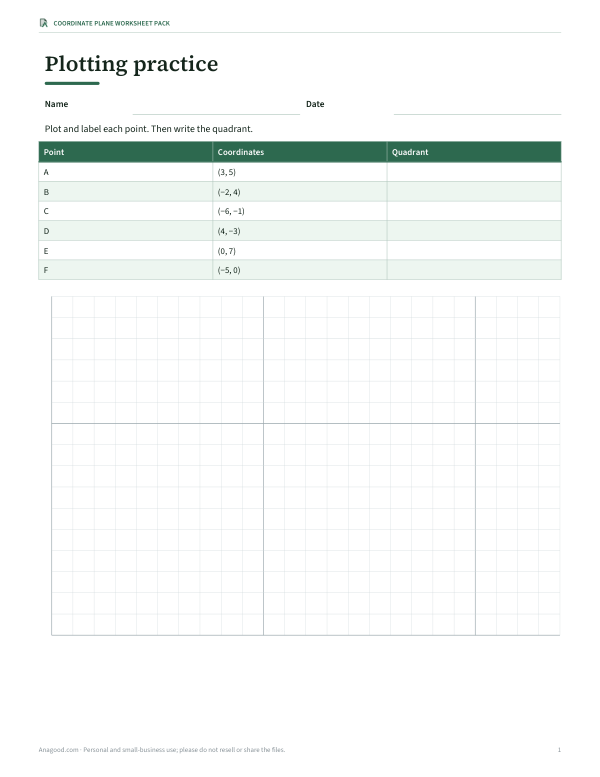
Print coordinate planes for maths class in seconds. Choose four quadrants or the first quadrant only, the range of each axis, whether to number the axes, and how many grids per page. You can also type points to plot them — perfect for making worksheets and answer keys.
- Free to use
- No sign-up
- Runs in your browser
Create coordinate grids
Coordinate Plane Worksheet Pack
Ready-made coordinate worksheets: plotting practice, mystery picture activities, transformations and graphing lines, with answer keys.
- Blank coordinate grids (PDF)
- Plotting practice with answer key (PDF, DOCX)
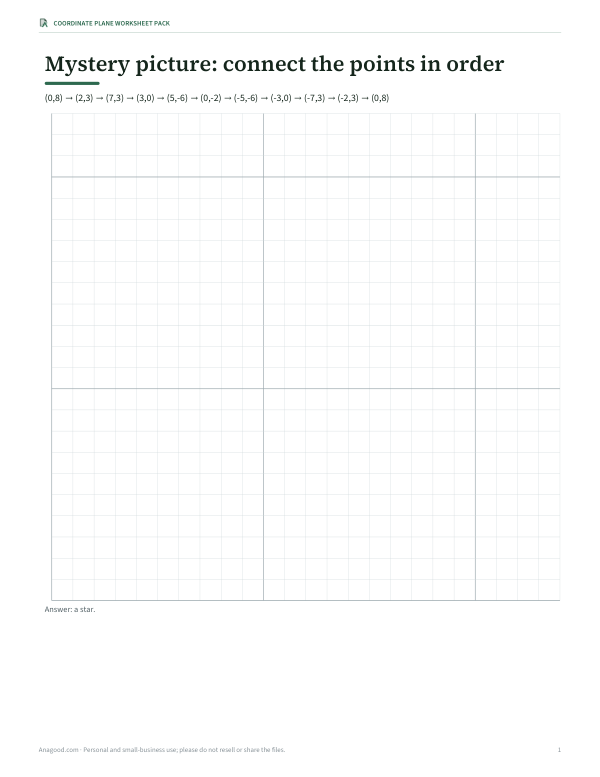
- Mystery picture activity (PDF, DOCX)
Formats: PDF, DOCX. Instant download after payment (link valid 72 hours, up to 5 downloads). AI-assisted: the templates were drafted with AI help and reviewed and laid out before publishing.
$4.00 USD, one-time 3 files · about $1.33 each
- Instant download
- 7-day refund
- Secure checkout by Stripe
7-day money-back guarantee. Full refund within 7 days of purchase, even after you download.
Full refund within 7 days — see the refund policy and license.
Free printables
Single sheets you can print right now, no sign-up. The full pack adds every sheet in one download plus the editable files.
What a coordinate grid is
A coordinate grid, or coordinate plane, is two number lines that cross at right angles. The horizontal line is the x-axis, the vertical line is the y-axis, and they meet at the origin, (0, 0). Every point on the plane is described by an ordered pair (x, y): first how far to move left or right from the origin, then how far up or down. Coordinate grids are used from upper elementary maths through algebra, geometry and science graphing.
First quadrant or four quadrants?
The axes divide the plane into four quadrants, numbered I to IV anticlockwise starting from the top right. In quadrant I both coordinates are positive; in II, x is negative and y positive; in III both are negative; in IV, x is positive and y negative. Younger students usually start with first-quadrant grids (0 to 10) to learn plotting without negative numbers, typically around grade 5. Four-quadrant grids come in when students learn negative numbers, often in grade 6, and are used throughout algebra for graphing lines and functions.
| Quadrant | x | y | Example |
|---|---|---|---|
| I | + | + | (3, 4) |
| II | − | + | (−3, 4) |
| III | − | − | (−3, −4) |
| IV | + | − | (3, −4) |
How to plot a point
- Start at the origin (0, 0).
- Read the x-coordinate and move right if positive or left if negative.
- From there, read the y-coordinate and move up if positive or down if negative.
- Mark the point and label it with its letter.
A helpful phrase for students is “along the corridor, then up the stairs”: x first, then y.
Making worksheets with the plotter
Type points into the box — for example A(2,3) B(−4,1) C(−2,−5) — and they are plotted and labelled on the first grid on the page. Teachers use this to create answer keys, “plot the points and connect them to reveal a picture” activities, and graphing examples. Print one copy with points as the key and one without for students by clearing the box.
Choosing range and grids per page
- ±10, one per page — large squares for younger students, demonstrations and interactive notebooks.
- ±10, four per page — practice sets and homework.
- ±5, six per page — quick plotting drills and exit tickets.
- ±15 or ±20 — graphing lines with larger intercepts, science data and transformations.
- No numbers — students number the axes themselves, practising scale.
Classroom activities
- Coordinate battleship: each player hides ships on a four-quadrant grid and calls out coordinates.
- Mystery pictures: plot a list of points in order and connect them to reveal a shape.
- Transformations: draw a shape, then reflect, translate or rotate it and record new coordinates.
- Graphing equations: make a table of x and y values for y = 2x + 1 and plot the line.
- Distance and midpoint: plot two points and calculate the distance and midpoint.
- Map skills: use the grid as a treasure map with coordinates for landmarks.
Worked example
Plot the triangle A(2, 3), B(−4, 1) and C(−2, −5). A is 2 right and 3 up in quadrant I; B is 4 left and 1 up in quadrant II; C is 2 left and 5 down in quadrant III. Connect them to draw the triangle. Reflecting it across the y-axis changes the sign of each x-coordinate, giving A′(−2, 3), B′(4, 1) and C′(2, −5).
Graphing lines and functions
In algebra, coordinate grids are where equations become pictures. To graph y = 2x + 1, make a small table of values — x = −2, −1, 0, 1, 2 give y = −3, −1, 1, 3, 5 — then plot the points and draw a straight line through them. The slope, 2, shows as “up two for every one to the right”, and the y-intercept, 1, is where the line crosses the y-axis. Four-quadrant grids with a range of ±10 fit most classroom examples; choose ±15 or ±20 for steeper lines or larger intercepts, and use the plotter to mark the table points for an answer key.
Printing tips
Print at 100% scale so squares stay square. The grids use light grey lines with dark axes so students' pencil marks stand out, and they photocopy well. Laminated grids work with dry-erase markers for repeated practice. Choose “Save as PDF” in the print dialog to keep a copy or share with students online.
Frequently asked questions
What grade learns coordinate grids?
First-quadrant graphing is often taught around grade 5; four quadrants and negative numbers around grade 6.
Which comes first, x or y?
x (horizontal) always comes first in an ordered pair (x, y).
Can I print a coordinate grid without numbers?
Yes, choose “No numbers” so students label the axes themselves.
Can I plot points automatically?
Yes, type points like A(2,3) B(-4,1) and they appear on the first grid.
Are the grids free?
Yes, print as many as you need for class or home.
What paper size is used?
US Letter; they also print on A4 with “Fit to page”.
How do I label the axes?
Label the horizontal axis x and the vertical axis y, number them at equal intervals, and write the scale if each square represents more than one unit.
What is the origin?
The point (0, 0) where the x-axis and y-axis cross.
How do I find the distance between two points?
Use the distance formula: the square root of (x₂ − x₁)² + (y₂ − y₁)². For points on the same horizontal or vertical line, simply count the squares.
Can I use the grids for science graphs?
Yes. Use the first-quadrant option for most experimental data, which usually has positive values, and label each axis with the quantity and unit.